
Body Mass Index
Body weight is used as an indicator of an individual's health. It is usually compared to tables that list "ideal" or "desirable" weight ranges for specific heights. Some of these tables use values gathered from research studies, while some include the heights and weights of individuals who have bought life insurance (e.g., the Metropolitan Height and Weight Tables). An individual's weight can be described as a percentage of the ideal or desirable weight listed, and can also be categorized as healthy, underweight, over-weight , or obese . An additional method of comparing an individual to a population group is with the body mass index .
Body mass index (BMI) is an estimate of body composition that correlates an individual's weight and height to lean body mass. The BMI is thus an index of weight adjusted for stature. Body mass index is figured by dividing weight in kilograms by height in meters squared and multiplying by 100. It can also be figured by dividing weight in pounds by height in inches squared and multiplying by 705. High values can indicate excessive fat stores, while low values can indicate reduced fat stores. In this way, the BMI
![BMI, or body mass index, is a number that correlates a person's height and weight. It is a useful tool for diagnosing obesity or malnutrition; however, such diagnosis should take into account a person's age, gender, fitness, and ethnicity. [Ed Bock/Corbis. Reproduced by permission.]](../images/nwaz_01_img0035.jpg)
However, when evaluating the BMI, several characteristics of an individual need to be known. An individual's age, gender, ethnicity, and level of fitness must be considered when using BMI to determine health risk. Also, the significance of the BMI is affected by disease state and hydration status. As with most assessment tools, the BMI is most effective when used in conjunction with other measurements.
Tables are available to identify the significance of the BMI. Calculations based on values for ideal body weight suggest the BMI for normal men and women should be in the range of 19 to 27 kg/m 2 . This range corresponds to the 25th to 75th percentile values recorded from adults followed in the 1971–1974 National Health and Nutrition Examination Survey (NHANES). Tables also list levels of protein-energy malnutrition and obesity. These values were determined by research in which height, weight, and age were associated with functional measurements and health outcomes.
A BMI between 13 and 15 corresponds to 48 to 55 percent of desirable body weight for a given height and describes the lowest body weight that can sustain life. Body weight at this level consists of less than 5 percent fat. The maximum survival body weight is about 500 kg, which corresponds to a BMI of about 150.
Research with children indicates annual increases in BMI are usually due to increases in lean mass rather than fat tissue. Not until late adolescence does fat mass begin to affect the BMI—and adult values begin to be achieved.
There is a strong correlation between BMI and total fat mass, though individual variation in body type or height can cause misclassification. Unfortunately,
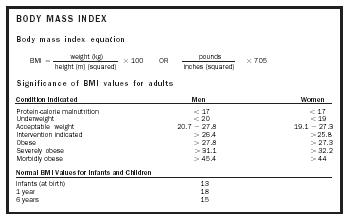
Body mass index equation
Significance of BMI values for adults
| Condition Indicated | Men | Women |
| Protein-calorie malnutrition | < 17 | < 17 |
| Underweight | < 20 | < 19 |
| Acceptable weight | 20.7 – 27.8 | 19.1 – 27.3 |
| Intervention indicated | > 26.4 | > 25.8 |
| Obese | > 27.8 | > 27.3 |
| Severely obese | > 31.1 | > 32.2 |
| Morbidly obese | > 45.4 | > 44 |
| Normal BMI Values for Infants and Children | ||
| Infants (at birth) | 13 | |
| 1 year | 18 | |
| 6 years | 15 | |
the same BMI value can correlate with a range of body-fat percentage. For example, athletes usually have large skeletal muscles (which weigh more than fat) and therefore a high BMI, but they are not obese. Shorter individuals can also be identified as obese, since their BMIs are usually high. An older individual may have a higher body-fat percentage than a younger individual, but have the same BMI. Adult females can have a BMI of 20, which correlates to a body-fat percentage of 13 to 32 percent, while adult males can have a BMI of 27 and a body-fat percentage of 10 to 31 percent.
Findings from the third NHANES (1988–1994) describe misidentification of the elderly when self-reported height, rather than measured height, is used in the BMI equation. Height decreases over an individual's lifetime due to vertebral compression, loss of muscle tone, and postural slump. An individual may, therefore, report a height that is no longer accurate, and the resulting value will be lower than the value that actually describes the individual, possibly leading to the wrong intervention.
Research has shown that both high BMIs and low BMIs can indicate increased morbidity and mortality. A low BMI, usually an indication of protein-energy malnutrition or the effects of wasting or a disease process, is a significant predictor of mortality among young and old hospitalized patients. A high BMI has been shown to be predictive of mortality only among young hospitalized patients, usually an effect of cardiovascular disease and obesity. Risk of mortality is only slightly elevated at the highest BMI for elderly hospitalized patients.
Because ethnicity has been shown to require adjustments to the levels of concern for the BMI, care must be taken when comparing different population groups. For example, Asian populations may require a lower BMI to describe health risk, while Pacific populations, specifically Hawaiian, may require a higher threshold to indicate that an individual is at risk. This variation can be explained by body type.
BMI and waist circumference have been used to evaluate health risks associated with overweight and obesity. Because both are easy measures to do, standardization of both are encouraged for widespread use as a reference. Additionally, the two measurements have been used in an algorithm with a cardiovascular risk index to determine which individuals would benefit most from weight loss.
BMI is an easy measurement to make—only requiring a tape measure, scale, and, perhaps, a calculator. However, for individuals who have trouble standing up straight for an accurate height measurement—either from disease process, weakness, or kyphosis (abnormal backward curvature of the spine)—BMI may not be an easy or accurate assessment tool to use. Comparisons between BMI and mid-upper arm circumference (MUAC) measurements show that they identify the same level of malnutrition in individuals. MUAC is also easily measured (it requires only a tape measure), and it is a good indicator of change in body weight and muscle mass. Standardization of these two assessment tools for reference would benefit the science of nutrition assessment.
SEE ALSO Aging and Nutrition ; Body Fat Distribution ; Diet ; Malnutrition ; Nutrition Assessment ; Obesity ; Overweight ; Underweight ; Waist-to-Hip Ratio .
Carole S. Mackey
Bibliography
Collins, Steve (1996). "Using Middle Upper Arm Circumference to Assess Severe Adult Malnutrition During Famine." Journal of the American Medical Association 276(5):391–395.
Kiernan, M. (2000). "Identifying Patients for Weight-Loss Treatment: An Empirical Evaluation of the NHLBI Obesity Education Initiative Expert Panel Treatment Recommendations." Archives of Internal Medicine 160:2169–2176.
Kuczmarski, Marie Fanelli (2001). "Effects of Age on Validity of Self-Reported Height, Weight, and Body Mass Index: Findings from the Third National Health and Nutrition Survey, 1988–1994." Journal of the American Dietetic Association 101(1):28–34.
Landi, F. (2000). "Body Mass Index and Mortality Among Hospitalized Patients." Archives of Internal Medicine 160:2641–2644.
Maskarinec, G. (2000). "Dietary Patterns Are Associated with Body Mass Index in Multiethnic Women." Journal of Nutrition 130:3068–3072.
Maynard, L. M. (2001). "Childhood Body Composition in Relation to Body Mass Index." Pediatrics 107:344–350.
Pike, Ruth, and Brown, Myrtle L. (1984). Nutrition, An Integrated Approach. New York: John Wiley.
Seidel, J. C. (2001). "Report from a CDC Prevention Workshop on Use of Adult Anthropometry for Public Health and Primary Health Care." American Journal of Clinical Nutrition 73:123–126.
Shills, Maurice E.; Olson, James A.; and Shike, Moshe. (1994). Modern Nutrition in Health and Disease, 8th edition. Philadelphia: Lea & Febiger.
White, Jane V. (1999). "The Utility of Body Mass Index in Predicting Health Risk." Consultant Dietitian 24(2).