
Nutrition and Weight Control - The problem of overweight
The percentage of overweight people in this country has been increasing steadily, chiefly because people eat more and use less physical energy than they used to. Americans do very little walking because of the availability of cars; they do very little manual labor because of the increasing use of machines. They may eat good wholesome meals, but they have the time for nibbling at all hours, especially when sitting in front of the television screen.
These patterns usually begin in childhood. Youngsters rarely walk to school any more; they get there by bus or car. They often have extra money for snacks and soft drinks, and frequently parents encourage them to overeat without realizing that such habits do them more harm than good.
Most overweight children remain overweight as adults. They also have greater difficulty losing fat, and if they do lose it, tend to regain it more easily than overweight adults who were thin as children. Many adults become overweight between the ages of 20 and 30. Thus, by age 30, about 12 percent of American men and women are 20 percent or more overweight, and by age 60, about 30 percent of the male population and 50 percent of the female are at least 20 percent overweight. As indicated above, the phenomenon of weight gain while aging does not represent biological normalcy.
Why People Put On Weight
Why does weight gain happen? Excess weight is the result of the imbalance between caloric intake as food and caloric expenditure as energy, either in maintaining the basic metabolic processes necessary to sustain life or in performing physical activity. Calories not spent in either of these ways become converted to fat and accumulate in the body as fat, or adipose tissue.
A calorie is the unit of measurement that describes the amount of energy potentially available in a given food. It is also used to describe the amount of energy the body must use up to perform a given function.
Counting Calories
If an adult gets the average 3,000 calories a day in his food from the age of 20 to 70, he will have consumed about 55 million calories. About 60 percent of these calories will have been used for his basic metabolic processes. The rest—22 million calories—might have resulted in a gain of about 6,000 pounds of fat, since each group of 3,500 extra calories could have produced one pound of fat.
In some ways, it's a miracle that people don't become more obese than they do. The reason, of course, is that most or all of these extra calories are normally used to provide energy for physical activity. Elsewhere in this chapter are some examples of calorie expenditure during various activities.
A reasonably good way for an adult to figure his daily caloric needs for moderate activities is to multiply his desirable weight by 18 for men and 16 for women. If the typical day includes vigorous or strenuous activities, extra calories will, of course, be required.
Parental Influences and Hereditary Factors
Although there are exceptions, almost all obese people consume more calories than they expend. The reasons for this imbalance are complex. One has to do with parental weight. If the weight of both parents is normal, there is only a 10 percent likelihood that the children will be obese. If one parent is obese, there is a 50 percent probability that the children will be too, and if both are, the probability of obese offspring is 80 percent.
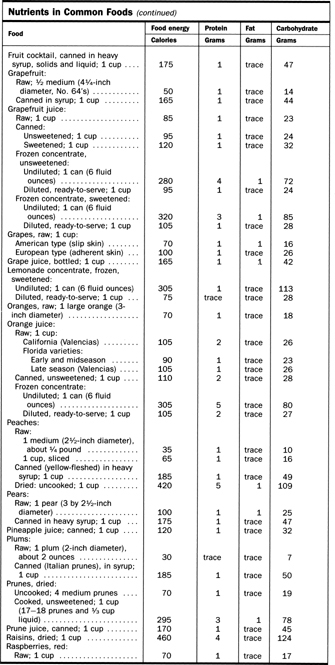
| Food | Food energy | Protein | Fat | Carbohydrate |
|---|---|---|---|---|
| Calories | Grams | Grams | Grams | |
| Fruit cocktail, canned in heavy syrup, solids and liquid; 1 cup | 175 | 1 | trace | 47 |
| Grapefruit: | ||||
| Raw; ½ medium (4¼-inch diameter, No. 64's) | 50 | 1 | trace | 14 |
| Canned in syrup; 1 cup | 165 | 1 | trace | 44 |
| Grapefruit juice: | ||||
| Raw; 1 cup | 85 | 1 | trace | 23 |
| Canned: | ||||
| Unsweetened; 1 cup | 95 | 1 | trace | 24 |
| Sweetened; 1 cup | 120 | 1 | trace | 32 |
| Frozen concentrate, unsweetened: | ||||
| Undiluted; 1 can (6 fluid ounces) | 280 | 4 | 1 | 72 |
| Diluted, ready-to-serve; 1 cup | 95 | 1 | trace | 24 |
| Frozen concentrate, sweetened: | ||||
| Undiluted; 1 can (6 fluid ounces) | 320 | 3 | 1 | 85 |
| Diluted, ready-to-serve; 1 cup | 105 | 1 | trace | 28 |
| Grapes, raw; 1 cup: | ||||
| American type (slip skin) | 70 | 1 | 1 | 16 |
| European type (adherent skin) | 100 | 1 | trace | 26 |
| Grape juice, bottled; 1 cup | 165 | 1 | 1 | 42 |
| Lemonade concentrate, frozen, sweetened: | ||||
| Undiluted; 1 can (6 fluid ounces) | 305 | 1 | trace | 113 |
| Diluted, ready-to-serve; 1 cup | 75 | trace | trace | 28 |
| Oranges, raw; 1 large orange (3-inch diameter) | 70 | 1 | trace | 18 |
| Orange juice: | ||||
| Raw; 1 cup: | ||||
| California (Valencias) | 105 | 2 | trace | 26 |
| Florida varieties: | ||||
| Early and midseason | 90 | 1 | trace | 23 |
| Late season (Valencias) | 105 | 1 | trace | 26 |
| Canned, unsweetened; 1 cup | 110 | 2 | trace | 28 |
| Frozen concentrate: | ||||
| Undiluted; 1 can (6 fluid ounces) | 305 | 5 | trace | 80 |
| Diluted, ready-to-serve; 1 cup | 105 | 2 | trace | 27 |
| Peaches: | ||||
| Raw: | ||||
| 1 medium (2½-inch diameter), about ¼ pound | 35 | 1 | trace | 10 |
| 1 cup, sliced | 65 | 1 | trace | 16 |
| Canned (yellow-fleshed) in heavy syrup; 1 cup | 185 | 1 | trace | 49 |
| Dried: uncooked; 1 cup | 420 | 5 | 1 | 109 |
| Pears: | ||||
| Raw; 1 pear (3 by 2½-inch diameter). | 100 | 1 | 1 | 25 |
| Canned in heavy syrup; 1 cup | 175 | 1 | trace | 47 |
| Pineapple juice; canned; 1 cup | 120 | 1 | trace | 32 |
| Plums: | ||||
| Raw; 1 plum (2-inch diameter), about 2 ounces | 30 | trace | trace | 7 |
| Canned (Italian prunes), in syrup; 1 cup | 185 | 1 | trace | 50 |
| Prunes, dried: | ||||
| Uncooked; 4 medium prunes | 70 | 1 | trace | 19 |
| Cooked, unsweetened; 1 cup (17-18 prunes and 1/3 cup liquid) | 295 | 3 | 1 | 78 |
| Prune juice, canned; 1 cup | 170 | 1 | trace | 45 |
| Raisins, dried; 1 cup | 460 | 4 | trace | 124 |
| Raspberries, red: | ||||
| Raw; 1 cup | 70 | 1 | trace | 17 |
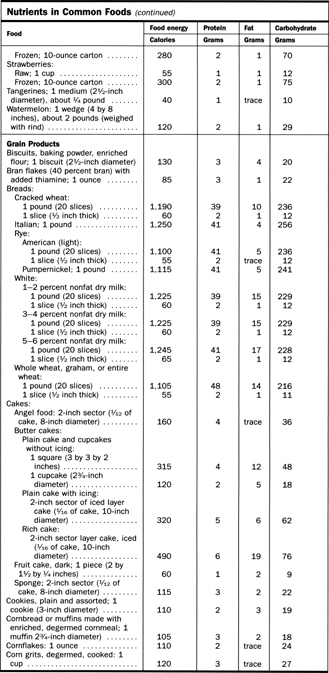
| Food | Food energy | Protein | Fat | Carbohydrate |
|---|---|---|---|---|
| Calories | Grams | Grams | Grams | |
| Frozen; 10-ounce carton | 280 | 2 | 1 | 70 |
| Strawberries: | ||||
| Raw; 1 cup | 55 | 1 | 1 | 12 |
| Frozen; 10-ounce carton | 300 | 2 | 1 | 75 |
| Tangerines; 1 medium (2½-inch diameter), about ¼ pound | 40 | 1 | trace | 10 |
| Watermelon: 1 wedge (4 by 8 Inches), about 2 pounds (weighed with rind) | 120 | 2 | 1 | 29 |
| Grain Products | ||||
| Biscuits, baking powder, enriched flour; 1 biscuit (2½-inch diameter) | 130 | 3 | 4 | 20 |
| Bran flakes (40 percent bran) with added thiamine; 1 ounce | 85 | 3 | 1 | 22 |
| Breads: | ||||
| Cracked wheat: | ||||
| 1 pound (20 slices) | 1,190 | 39 | 10 | 236 |
| 1 slice (½ inch thick) | 60 | 2 | 1 | 12 |
| Italian; 1 pound | 1,250 | 41 | 4 | 256 |
| Rye: | ||||
| American (light): | ||||
| 1 pound (20 slices) | 1,100 | 41 | 5 | 236 |
| 1 slice (½ inch thick) | 55 | 2 | trace | 12 |
| Pumpernickel; 1 pound | 1,115 | 41 | 5 | 241 |
| White: | ||||
| 1–2 percent nonfat dry milk: | ||||
| 1 pound (20 slices) | 1,225 | 39 | 15 | 229 |
| 1 slice (½ inch thick) | 60 | 2 | 1 | 12 |
| 3–4 percent nonfat dry milk: | ||||
| 1 pound (20 slices) | 1,225 | 39 | 15 | 229 |
| 1 slice (½ inch thick) | 60 | 2 | 1 | 12 |
| 5–6 percent nonfat dry milk: | ||||
| 1 pound (20 slices) | 1,245 | 41 | 17 | 228 |
| 1 slice (½ inch thick) | 65 | 2 | 1 | 12 |
| Whole wheat, graham, or entire | ||||
| wheat: | ||||
| 1 pound (20 slices) | 1,105 | 48 | 14 | 216 |
| 1 slice (½ inch thick) | 55 | 2 | 1 | 11 |
| Cakes: | ||||
| Angel food: 2-inch sector (1/12 of cake, 8-inch diameter) | 160 | 4 | trace | 36 |
| Butter cakes: | ||||
| Plain cake and cupcakes without icing: | ||||
| 1 square (3 by 3 by 2 inches) | 315 | 4 | 12 | 48 |
| 1 cupcake (2¾-inch diameter). | 120 | 2 | 5 | 18 |
| Plain cake with icing: | ||||
| 2-inch sector of iced layer cake (1/16 of cake, 10-inch diameter) | 320 | 5 | 6 | 62 |
| Rich cake: | ||||
| 2-inch sector layer cake, iced (1/16 of cake, 10-inch diameter) | 490 | 6 | 19 | 76 |
| Fruit cake, dark; 1 piece (2 by 1½ by ¼ inches) | 60 | 1 | 2 | 9 |
| Sponge; 2-inch sector (1/12 of cake, 8-inch diameter). | 115 | 3 | 2 | 22 |
| Cookies, plain and assorted; 1 cookie (3-inch diameter) | 110 | 2 | 3 | 19 |
| Combread or muffins made with enriched, degermed cornmeal; 1 muffin 2¾-inch diameter) | 105 | 3 | 2 | 18 |
| Cornflakes: 1 ounce | 110 | 2 | trace | 24 |
| Corn grits, degermed, cooked: 1 cup | 120 | 3 | trace | 27 |
No one knows for certain why this is so. It is probably a combination of diet habits acquired in youth, conditioning during early years to react to emotional stress by eating, the absence of appropriate exercise patterns, and genetic inheritance.
Some obese people seem to have an impairment in the regulatory mechanism of the area of the central nervous system that governs food intake. Simply put, they do not know when to stop eating. Others, particularly girls, may eat less than their nonobese counterparts, but they are considerably less active. Some researchers think that obese people have an inherent muscle rhythm deficiency. A few people appear to have an abnormality in the metabolic process which results in the accumulation of fat even when the balance between calories taken in and expended is negative and should lead to weight loss.
Obesity and Health
There are many reasons why obesity is a health hazard. The annual death rate for obese people between the ages of 20 and 64 is half again as high as that for people whose weight is close to normal. This statistical difference is due primarily to the increased likelihood that the obese person will suffer from diabetes mellitus and from diseases of the digestive and circulatory systems, especially of the heart.
One possible reason for the increased possibility of heart disease is that there are about two-thirds of a mile of blood vessels in each pound of adipose tissue. Thus 20 or more pounds of excess weight are likely to impose a great additional work load on the heart.
Obese people are also poorer surgical risks than the nonobese, and it is often more difficult to diagnose and therefore to treat their illnesses correctly.
Permanent loss of excess weight makes the formerly obese person come closer to matching the life expectancy of the nonobese. However, losing and regaining weight as a repeated pattern is even more hazardous in terms of health than consistent obesity.
Psychological Consequences of Obesity
In ways that are both obvious and subtle, obesity often has damaging psychological consequences. This is particularly true for obese children, who tend to feel isolated and rejected by their peers. They may consider themselves victims of prejudice and blame their obesity for everything that goes wrong in their lives. In many cases, the destructive relationship between obesity and self-pity keeps perpetuating itself.
Obese adults are likely to experience the same feelings, but to a somewhat lesser degree. For some, obesity is an escape which consciously or unconsciously helps them to avoid situations in which they feel uncomfortable—those that involve active competition or relationships with the opposite sex.
Avoiding Excess Weight
Clearly, obesity is a condition that most people would like to avoid. Not putting on extra pounds does seem to be easier, in theory at least, than taking them off. One possible explanation for this is that additional adipose tissue consists of a proliferation of fat cells. Shrinking these cells is one thing, eliminating them is another. Our present lack of fundamental knowledge about the regulatory and metabolic mechanisms relating to obesity limits the technique of preventing overweight to recommending a balance between caloric intake and expenditure.
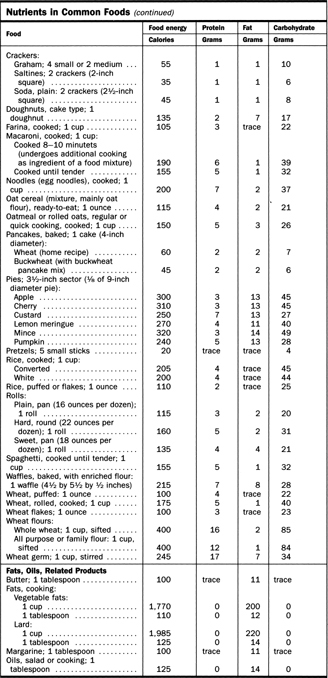
| Food | Food energy | Protein | Fat | Carbohydrate |
|---|---|---|---|---|
| Calories | Grams | Grams | Grams | |
| Crackers: Graham; 4 small or 2 medium | 55 | 1 | 1 | 10 |
| Saltines; 2 crackers (2-inch square) | 35 | 1 | 1 | 6 |
| Soda, plain: 2 crackers (2½-inch square) | 45 | 1 | 1 | 8 |
| Doughnuts, cake type; 1 doughnut | 135 | 2 | 7 | 17 |
| Farina, cooked; 1 cup | 105 | 3 | trace | 22 |
| Macaroni, cooked; 1 cup: | ||||
| Cooked 8-10 minutets (undergoes additional cooking as ingredient of a food mixture) | 190 | 6 | 1 | 39 |
| Cooked until tender | 155 | 5 | 1 | 32 |
| Noodles (egg noodles), cooked; 1 cup | 200 | 7 | 2 | 37 |
| Oat cereal (mixture, mainly oat flour), ready-to-eat; 1 ounce | 115 | 4 | 2 | 21 |
| Oatmeal or rolled oats, regular or quick cooking, cooked; 1 cup | 150 | 5 | 3 | 26 |
| Pancakes, baked; 1 cake (4-inch diameter): | ||||
| Wheat (home recipe) | 60 | 2 | 2 | 7 |
| Buckwheat (with buckwheat pancake mix) | 45 | 2 | 2 | 6 |
| Pies; 3½-inch sector (1/8 of 9-inch diameter pie): | ||||
| Apple | 300 | 3 | 13 | 45 |
| Cherry | 310 | 3 | 13 | 45 |
| Custard | 250 | 7 | 13 | 27 |
| Lemon meringue | 270 | 4 | 11 | 40 |
| Mince | 320 | 3 | 14 | 49 |
| Pumpkin | 240 | 5 | 13 | 28 |
| Pretzels; 5 small sticks | 20 | trace | trace | 4 |
| Rice, cooked; 1 cup: Converted | 205 | 4 | trace | 45 |
| White | 200 | 4 | trace | 44 |
| Rice, puffed or flakes; 1 ounce | 110 | 2 | trace | 25 |
| Rolls: | ||||
| Plain, pan (16 ounces per dozen); 1 roll | 115 | 3 | 2 | 20 |
| Hard, round (22 ounces per dozen); 1 roll | 160 | 5 | 2 | 31 |
| Sweet, pan (18 ounces per dozen); 1 roll | 135 | 4 | 4 | 21 |
| Spaghetti, cooked until tender; 1 cup | 155 | 5 | 1 | 32 |
| Waffles, baked, with enriched flour: | ||||
| 1 waffle (4½ by 5½ by ½ inches) | 215 | 7 | 8 | 28 |
| Wheat, puffed: 1 ounce | 100 | 4 | trace | 22 |
| Wheat, rolled, cooked; 1 cup | 175 | 5 | 1 | 40 |
| Wheat flakes; 1 ounce | 100 | 3 | trace | 23 |
| Wheat flours: | ||||
| Whole wheat; 1 cup, sifted | 400 | 16 | 2 | 85 |
| All purpose or family flour: 1 cup, sifted | 400 | 12 | 1 | 84 |
| Wheat germ; 1 cup, stirred | 245 | 17 | 7 | 34 |
| Fats, Oils, Related Products | ||||
| Butter; 1 tablespoon | 100 | trace | 11 | trace |
| Fats, cooking: | ||||
| Vegetable fats: | ||||
| 1 cup | 1,770 | 0 | 200 | 0 |
| 1 tablespoon | 110 | 0 | 12 | 0 |
| Lard: | ||||
| 1 cup | 1,985 | 0 | 220 | 0 |
| 1 tablespoon | 125 | 0 | 14 | 0 |
| Margarine; 1 tablespoon | 100 | trace | 11 | trace |
| Oils, salad or cooking; 1 tablespoon | 125 | 0 | 14 | 0 |
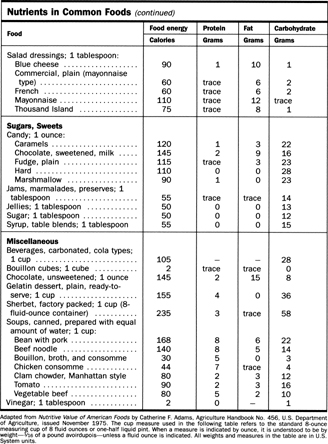
| Food | Food energy | Protein | Fat | Carbohydrate |
|---|---|---|---|---|
| Calories | Grams | Grams | Grams | |
| Adapted from Nutritive Value of American Foods by Catherine F. Adams, Agriculture Handbook No. 456, U.S. Department of Agriculture, issued November 1975. The cup measure used in the following table refers to the standard 8-ounce measuring cup of 8 fluid ounces or one-half liquid pint. When a measure is indicated by ounce, it is understood to be by weight—1/6; of a pound avoirdupois—unless a fluid ounce is indicated. All weights and measures in the table are in U.S. System units. | ||||
| Salad dressings; 1 tablespoon: Blue cheese | 90 | 1 | 10 | 1 |
| Commercial, plain (mayonnaise type) | 60 | trace | 6 | 2 |
| French | 60 | trace | 6 | 2 |
| Mayonnaise | 110 | trace | 12 | trace |
| Thousand Island | 75 | trace | 8 | 1 |
| Sugars, Sweets | ||||
| Candy; 1 ounce: | ||||
| Caramels | 120 | 1 | 3 | 22 |
| Chocolate, sweetened, milk | 145 | 2 | 9 | 16 |
| Fudge, plain | 115 | trace | 3 | 23 |
| Hard | 110 | 0 | 0 | 28 |
| Marshmallow | 90 | 1 | 0 | 23 |
| Jams, marmalades, preserves; 1 tablespoon | 55 | trace | trace | 14 |
| Jellies; 1 tablespoon | 50 | 0 | 0 | 13 |
| Sugar; 1 tablespoon. | 50 | 0 | 0 | 12 |
| Syrup, table blends; 1 tablespoon | 55 | 0 | 0 | 15 |
| Miscellaneous | ||||
| Beverages, carbonated, cola types; 1 cup | 105 | _ | _ | 28 |
| Bouillon cubes; 1 cube . | 2 | trace | trace | 0 |
| Chocolate, unsweetened; 1 ounce | 145 | 2 | 15 | 8 |
| Gelatin dessert, plain, ready-to-serve; 1 cup | 155 | 4 | 0 | 36 |
| Sherbet, factory packed; i cup (8-fluid-ounce container) | 235 | 3 | trace | 58 |
| Soups, canned, prepared with equal amount of water; 1 cup: Bean with pork | 168 | 8 | 6 | 22 |
| Beef noodle | 140 | 8 | 5 | 14 |
| Bouillon, broth, and consomme | 30 | 5 | 0 | 3 |
| Chicken consomme | 44 | 7 | trace | 4 |
| Clam chowder, Manhattan style | 80 | 2 | 3 | 12 |
| Tomato | 90 | 2 | 3 | 16 |
| Vegetable beef | 80 | 5 | 2 | 10 |
| Vinegar; 1 tablespoon | 2 | 0 | - | 1 |
The real responsibility for preventing the onset of obesity in childhood rests with parents. It is important for the parents to set a good example and to instill early on all of the fundamentals of good nutrition and healthy eating habits; these are of the utmost importance in this connection. Caloric expenditure in the form of regular exercise is equally important.
Exercising by Habit
This does not necessarily mean that exercise should be encouraged for its own sake. What it does mean is making a habit of choosing an active way of approaching a situation rather than a lazy way: walking upstairs rather than taking the elevator; walking to school rather than riding; walking while playing golf rather than riding in a cart; running to get the ball that has rolled away rather than ambling toward it. These choices should be made consistently and not just occasionally if obesity is to be avoided. Those people who naturally enjoy the more active way of doing things are lucky. Those who don't should make an effort to develop new patterns, especially if obesity is a family problem.
Anyone with the type of physical handicap that makes a normal amount of exercise impossible should be especially careful about caloric intake.
Comment about this article, ask questions, or add new information about this topic: